Up next in 10

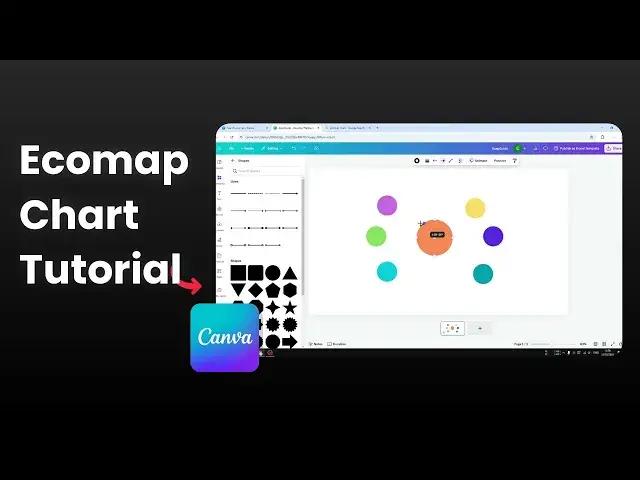
? Learn how to create a visually appealing ecomap chart using Canva in this easy-to-follow video. We'll guide you step-by-step through the process to help you effectively map out relationships and resources.
? Microphone: https://geni.us/KVRt
? Boom arm: https://geni.us/FU6y
? Web hosting: https://geni.us/BestWordPressHosting
❤ Subscribe if you find this video helpful:
https://www.youtube.com/@asapguide?sub_confirmation=1
Show More Show Less View Video Transcript
0:00
Hi, for this tutorial I'm going to show you how to create an eco map using time
0:05
club. So eco map is very similar to Babel map which I have covered before but
0:11
Ecomap is used to describe the relationship between one item with another. If I give you an
0:18
example here from Google image you will see that this is one great example of EpoMap
0:23
You can see that there is a person in the middle and there is a relationship between
0:29
family members and as you can see there are many different types of lines representing different
0:36
relationship some others are strong others are energy others are reciprocal weak
0:43
sternness etc actually this is just an arbitrary move that made by the person made this template
0:52
you can actually just use a different color to make it simple this is another example of an ecomap using a different color to describe a relationship But regardless I going to show you how you can create one for yourself using Conva
1:07
So let's start with a blank template. Go to elements. And on the shape section, you want to click the all
1:15
I'm going to insert this first circle. And let's change the color to orange
1:21
Now we have created the first circle. The next thing that we need to do is we have to create more circles surrounding this circle
1:29
And of course the process is the same, just go to elements again. And you can also just click on the circle based on the recently used item on your design
1:39
And I'm going to just change the color to maybe green. Now let's just duplicate this element
1:46
I'm not going to waste my time, so let's duplicate these elements quickly so we can get a really good or basically a really good or basically
1:54
basic design of this eco map Okay now we got this best eco map By the way you can always change the color later like this one or you can always make it more attractive or you want to use a different color
2:08
to describe the relationship between items in your chart okay so we have created this one and
2:16
after that we have to draw some line to connect one circle with another especially the circle in the
2:22
center to do that let's go to elements on the shape section click see all again
2:27
and now we can insert a line there are multiple lines that we can use I'm going to
2:32
insert this simple one and let's start with okay I think I'm going to copy this
2:39
example okay apparently this line or this arrow has an opposite end they have
2:47
I don't know the name the line and and the line start so basically each end will have
2:54
this arrow shape and by the way you can always increase the height of the line and if you want to use the same line for other circles then you can duplicate that line and connect it to a different circle and also you can change the line color if you
3:10
want to if you prefer to make it relevant or the same as the color of the circle you can do that as
3:16
well and of course you can change the style of the line so you can make it dash dotted etc
3:23
so this is useful to represent the meaning behind each line and after that you can add some text to describe the item the name of the item or maybe
3:35
the name of the person of this chart then you can start typing the name so this is of course not
3:41
a complete chart but i think based on what i have shown you this is pretty much how you can create
3:47
one using kanva so anyway you can continue upon this design you already know the knowledge on
3:54
how to build one so feel free to continue building an eco map for your purpose and thank you so much for watching
#Drawing & Coloring
#Maps